NETWORK INFO

This section is intended to provide instructions on how to find basic information about the network. These tools typically come installed by default on the majority of GNU/Linux based operating systems.
HOST DISCOVERY

The following tools can be used to discover the connectivity of various hosts and devices on a local or wide area network. These tools can also be used to find the IP address of a host along with the latency of the connection.
01
ping
Ping sends echo request packets to network hosts and waits for a response. It is used to check the availability of these hosts. They can be inside of your LAN, or outside of the local area network. The Ping command is usually the first step when trying to troubleshoot network connectivity issues.
Test connection to host
The following command will check for a connection from localhost(my computer) to a host on the Wide Area Network. A successful response will indicate connections outside of the LAN can be made. In this example startpage will be used, but any host outside of your LAN will be adequate. The -c 5 flag is used to stop the ping command after 5 iterations. If you don't specify a count, ctrl + c can be used to stop the ping requests.
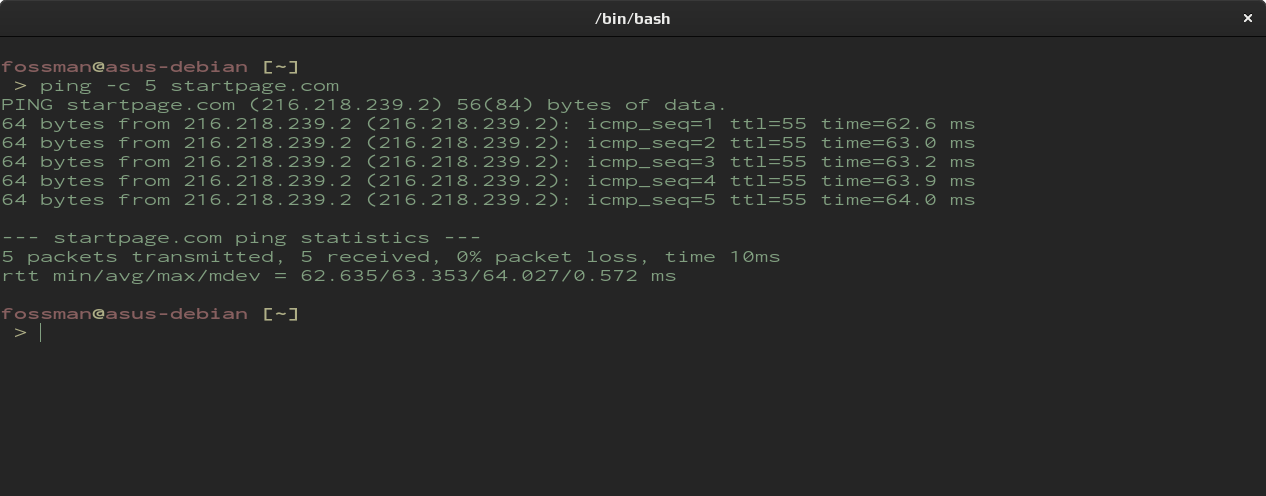
In the screenshot above, there were no packets lost. This result would indicate a successful connection between the client and host machine. As an added bonus, the IP address was also included in the response.
ROUTING TABLES

These tools can be used to show data located within routing tables, such as the location of the default gateway, check network connectivity, show interface statistics and more.
01
netstat
Netstat is a tool that can be used to print network connections, routing tables, interface statistics, masquerade connections and multiple memberships. In the example below, netstat will be used to find the IP address of the local gateway (router).
Find router's IP address
In the following command, the -r flag is used to display the routing table, and -n is used to display the output in a numerical value in place of the devices host name.
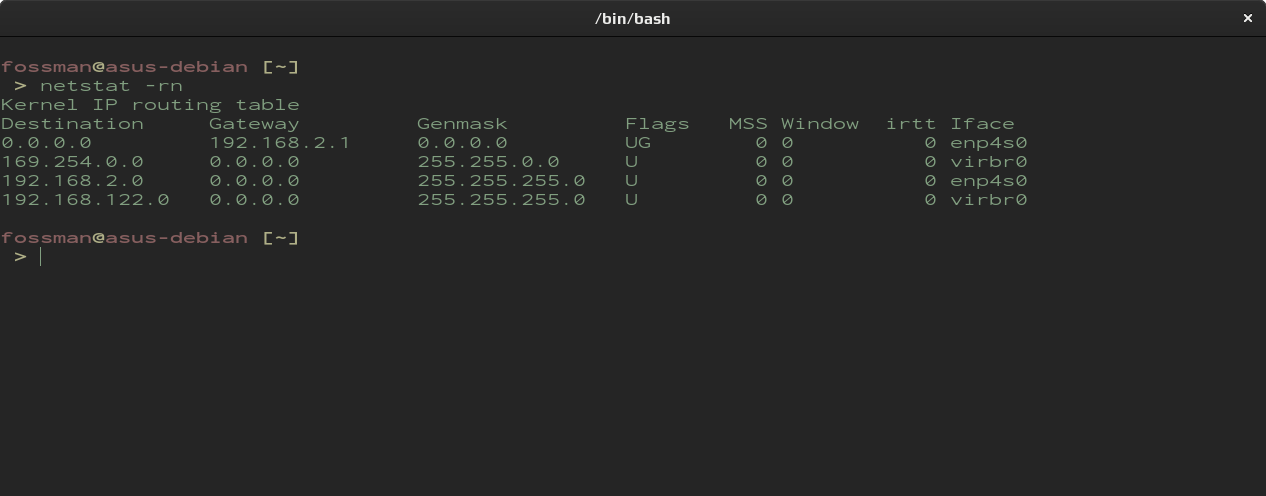
To locate the IP address of the router, look under Gateway
MAPPING

If you are looking for ways to map your network and find devices running on the network, the following tools can be used. They can also be used for security auditing to aid in the discovery of devices that are not supposed to be on the network in the first place.
01
nmap
Nmap is a utility used for network exploration or security auditing. It can be used to scan a network and return a complete list of hosts, including their IP address, hostnames and ports they may have open waiting for a connection.
Installing Nmap
The following command can be used to install nmap.
fossman@linux-server:~$ sudo apt install nmap
List available options
As you can see from the help file, Nmap is a very powerful tool that is equipped with many features and options.
Return list of hosts
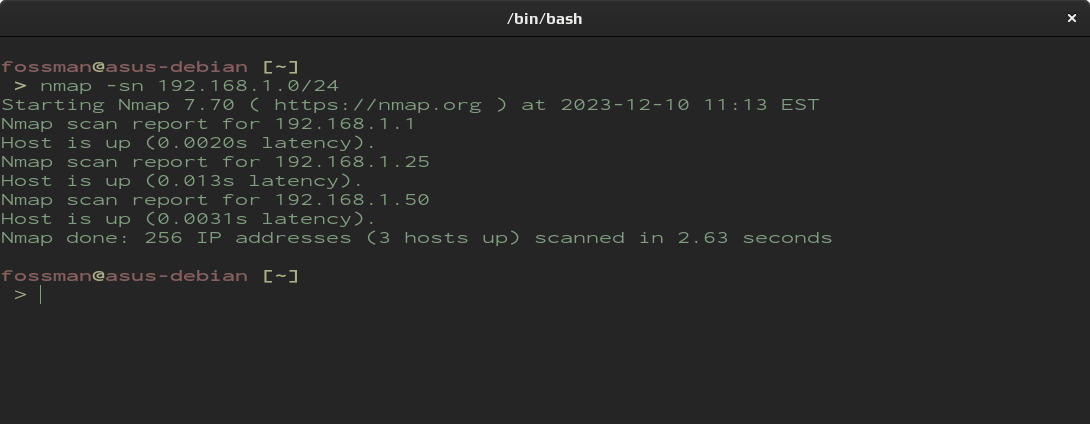
To find a host or hosts on your network, a simple ping scan can be used.
Shown below, the 192.168.1.0 network will be used as an example.
| namp | network mapping tool |
| -sn | simple ping scan (no ports) |
| 192.168.1.0/24 | scan entire subnet |
Include a verbose output with ports
After running the command above, we can see the nmap has returned a list of all the hosts on the network. For a more verbose output, the -v flag can be used as well as running the command with sudo which will also return the MAC address of each device. Additionally, nmap will also return a list of which ports are open if the command is run without any arguments.
For more options, refer to the --help or man pages.
MONITORING

01
tcpdump
Tcpdump displays the contents of internet packets being sent and received on the network. It can be used to detect possible threats, minimize congestion and manipulate traffic. The output can also be saved to a file for further analysis or to be used in a script.
Installation
Run the following commands in a terminal
fossman@linux-server:~$ sudo apt install tcpdump
Manual pages
To get a full list of commands, refer to the man page.
List interfaces
If an interface is not specified tcpdump will capture on all of them.

Choose a interface device to capture packets on.
Start capturing packets
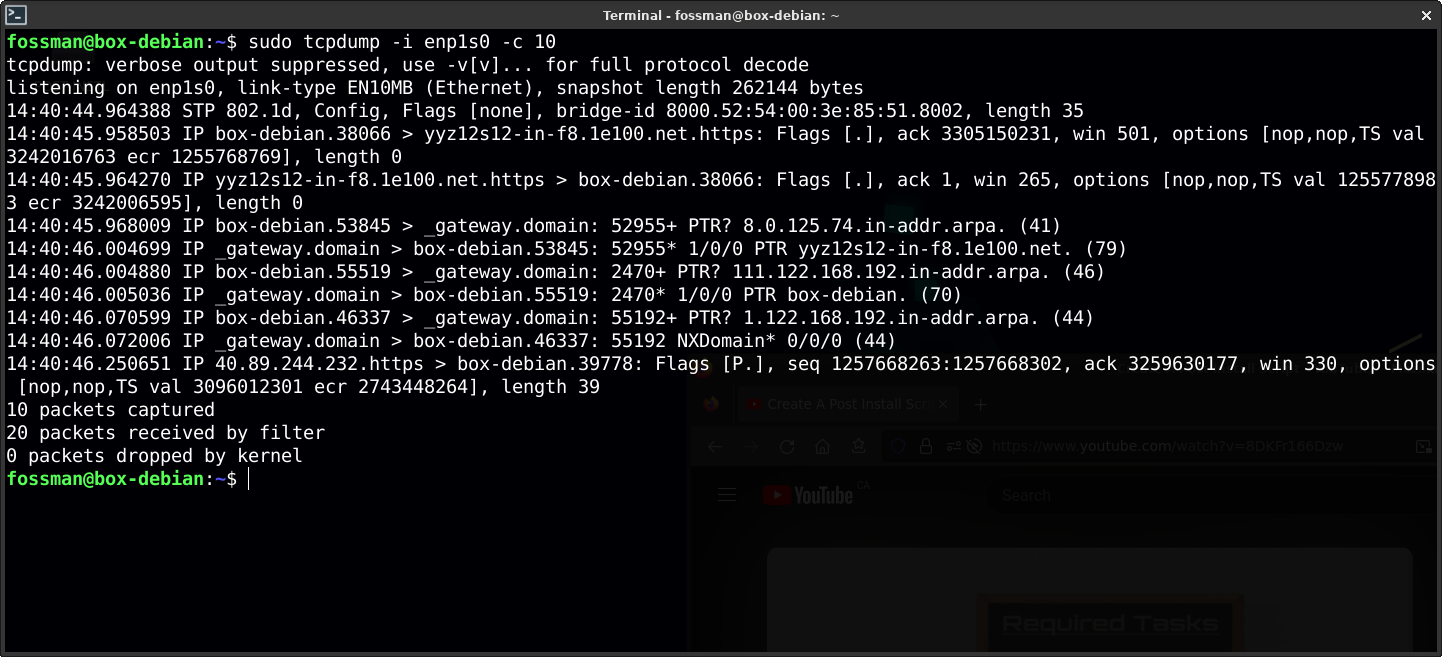
To begin to capture packets use the following command. In this example, 10 packets will be captured on the enp1s0 interface. If you do not specify a count, use ctrl + c to stop the packet capture.
| sudo tcpdump | packet capturing tool |
| -i enp1s0 | capture on enp1s0 |
| -c 10 | capture only 10 packets |
Save output to a file
Saving the capture to a file will provide the ability to analize it further with tools such as Wireshark. Use the following command to save the capture in a pcap file format called example.pcap

| sudo tcpdump | packet capturing tool |
| -i enp1s0 | capture on enp1s0 |
| -c 10 | capture only 10 packets |
| -w example.pcap | write output to exmaple.pcap |
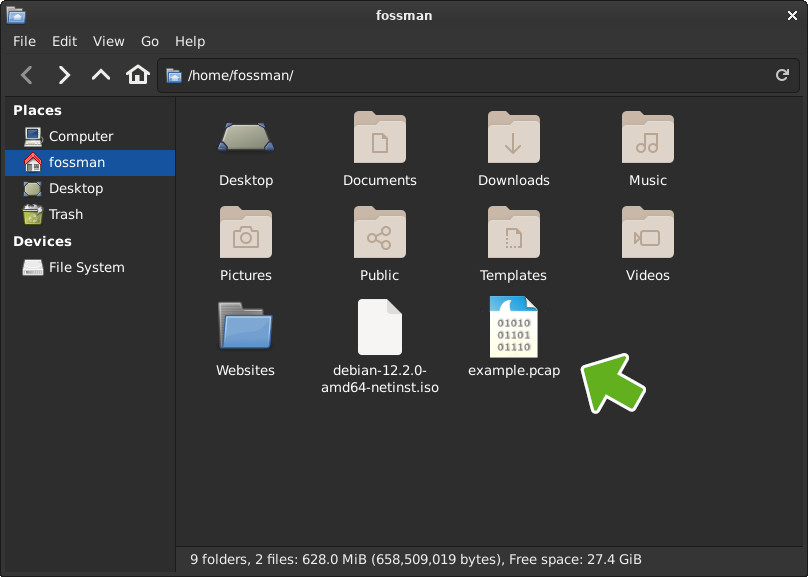
example.pcap created
The returned output was saved to the example.pcap file, resulting in nothing being returned to the screen. This day can now be analazed in a program such as Wireshark. Shown below is an example of this file.
02
Wireshark
To analyze this capture in more detail, it can be opened in a program such as Wireshark. You can either right-click on the file and select 'Open with other application' or you can use the terminal as shown in the command below.
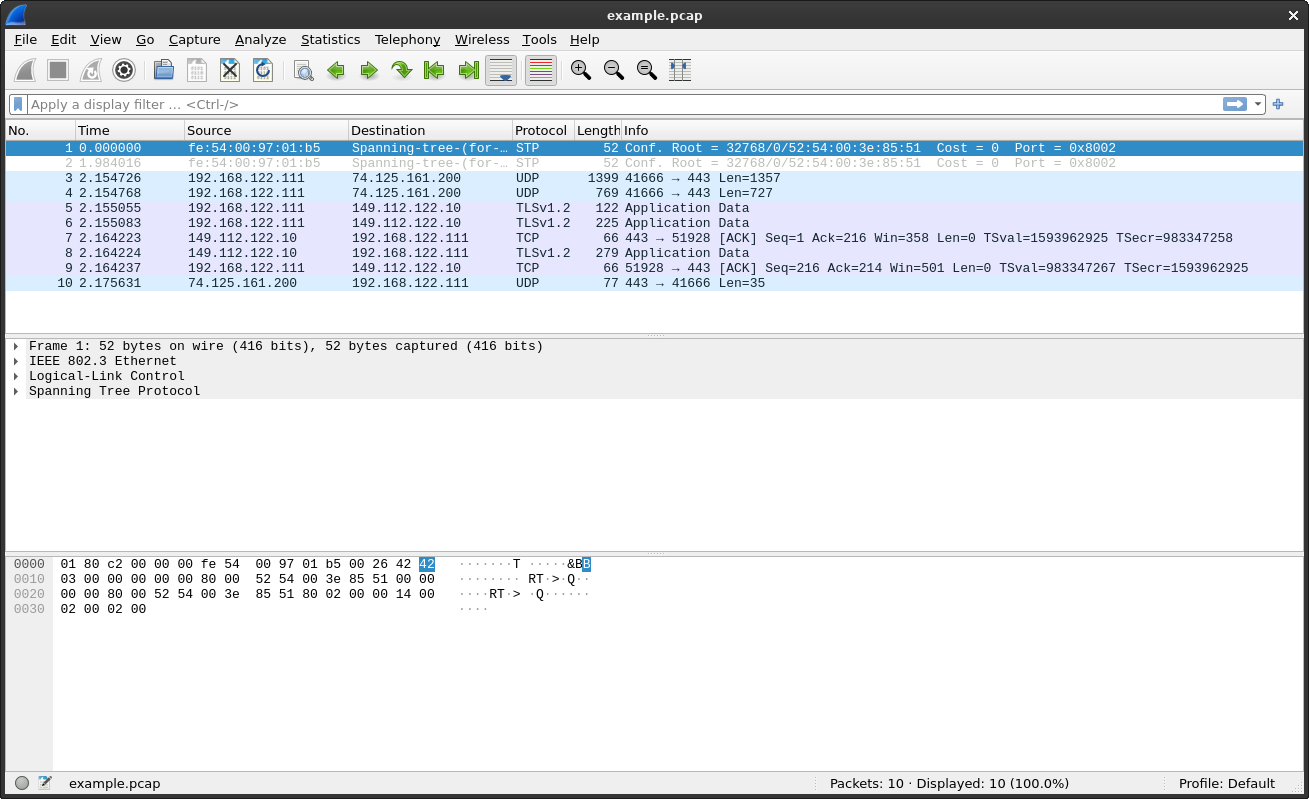
| wireshark | network packet analyzer |
| example.pcap | file to be analyzed. |
From here, there are many tools and filters available which can be utilized in various ways in order to narrow down these results. It may not seem necessary in this example, due to the fact this sample is so small. But if you are dealing with hundreds or thousands of request, they can be a life saver.
Install Wireshark
If Wireshark was not already been installed on your system, the following commands can be used.
The second command can be used to install the application on the system.
fossman@linux-server:~$ sudo usermod -a -G wireshark $USER
Select Yes when prompted if you would like non-super users to be able to capture packets on the system.

