SYSTEM MONITORING

After upgrading the system and installing the required software, there may be unused packages and old kernels still on the system. In their present state they are most likely harmless, but can build up over time. Cleaning up these files can be done with a single command in the terminal.
GENERAL TOOLS

The following tools provide information about the system using a graphical interface. The ones show here will most likely be installed by default when the operating system was installed.
01
System Monitor
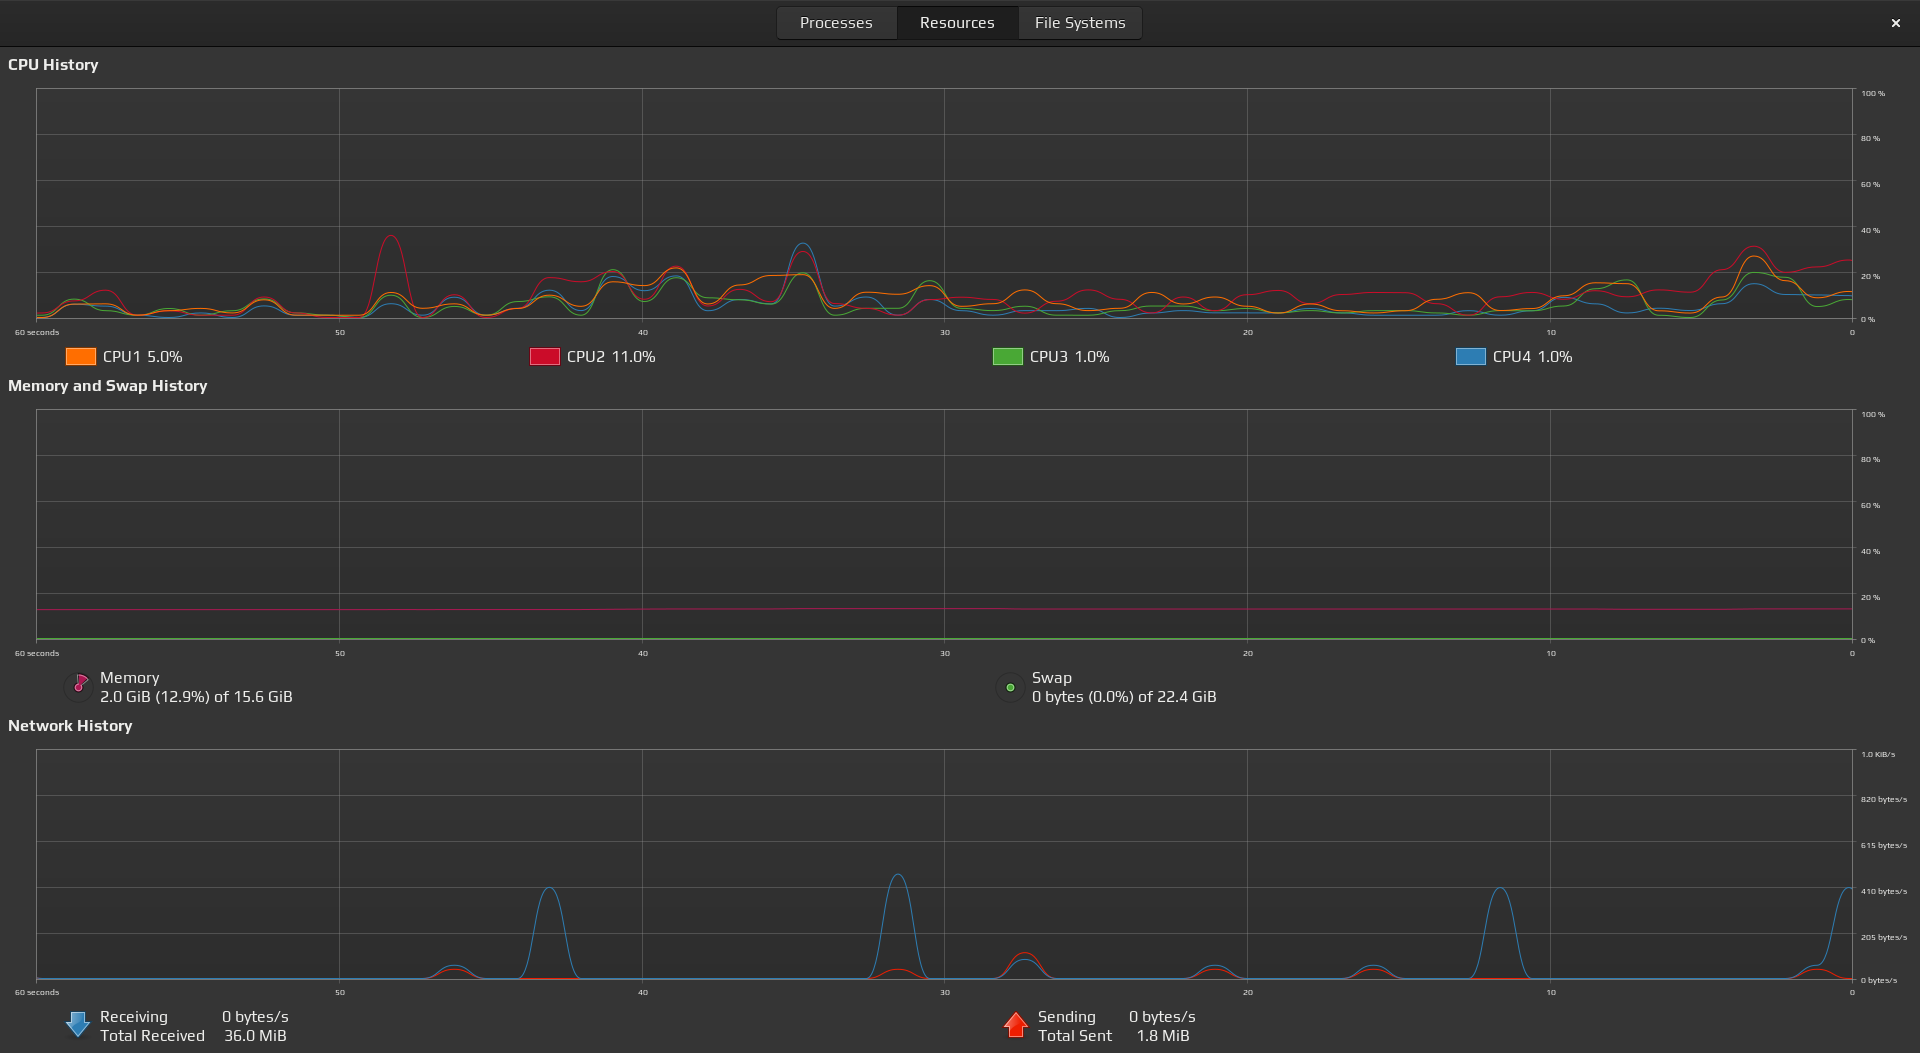
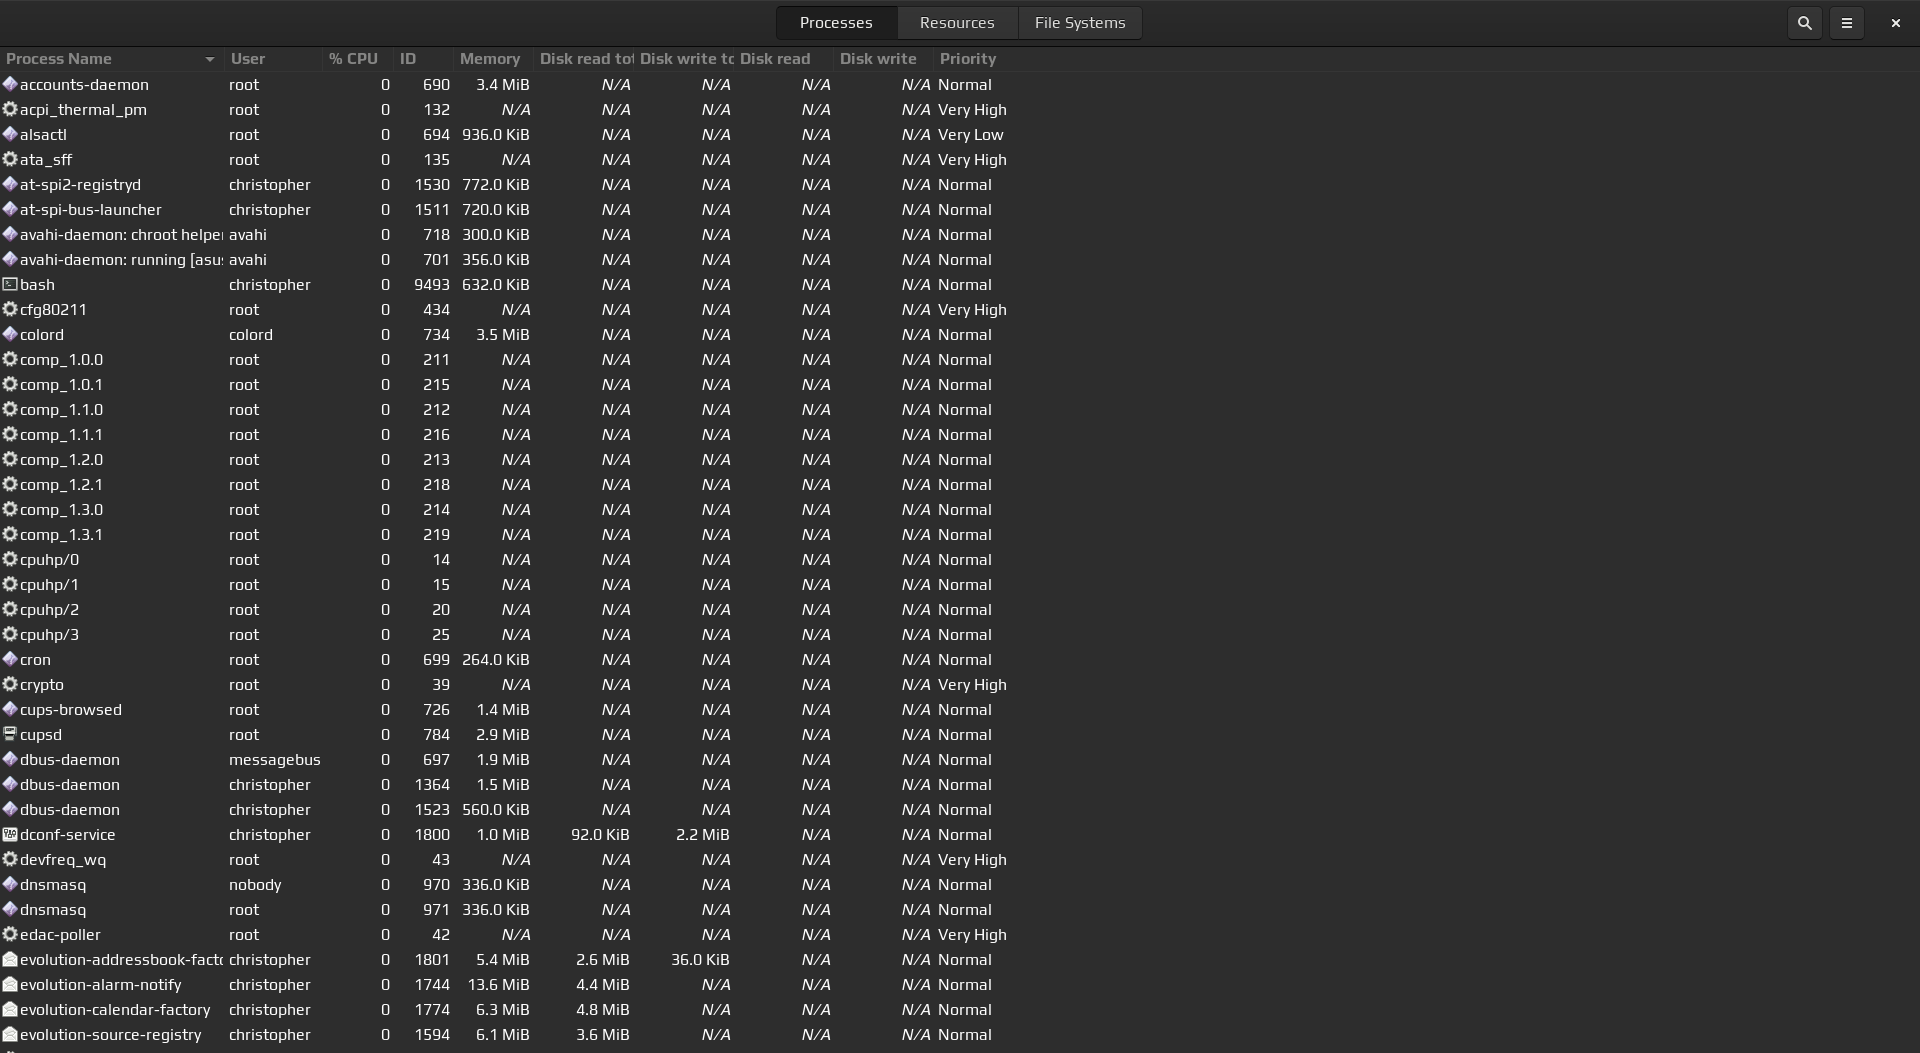
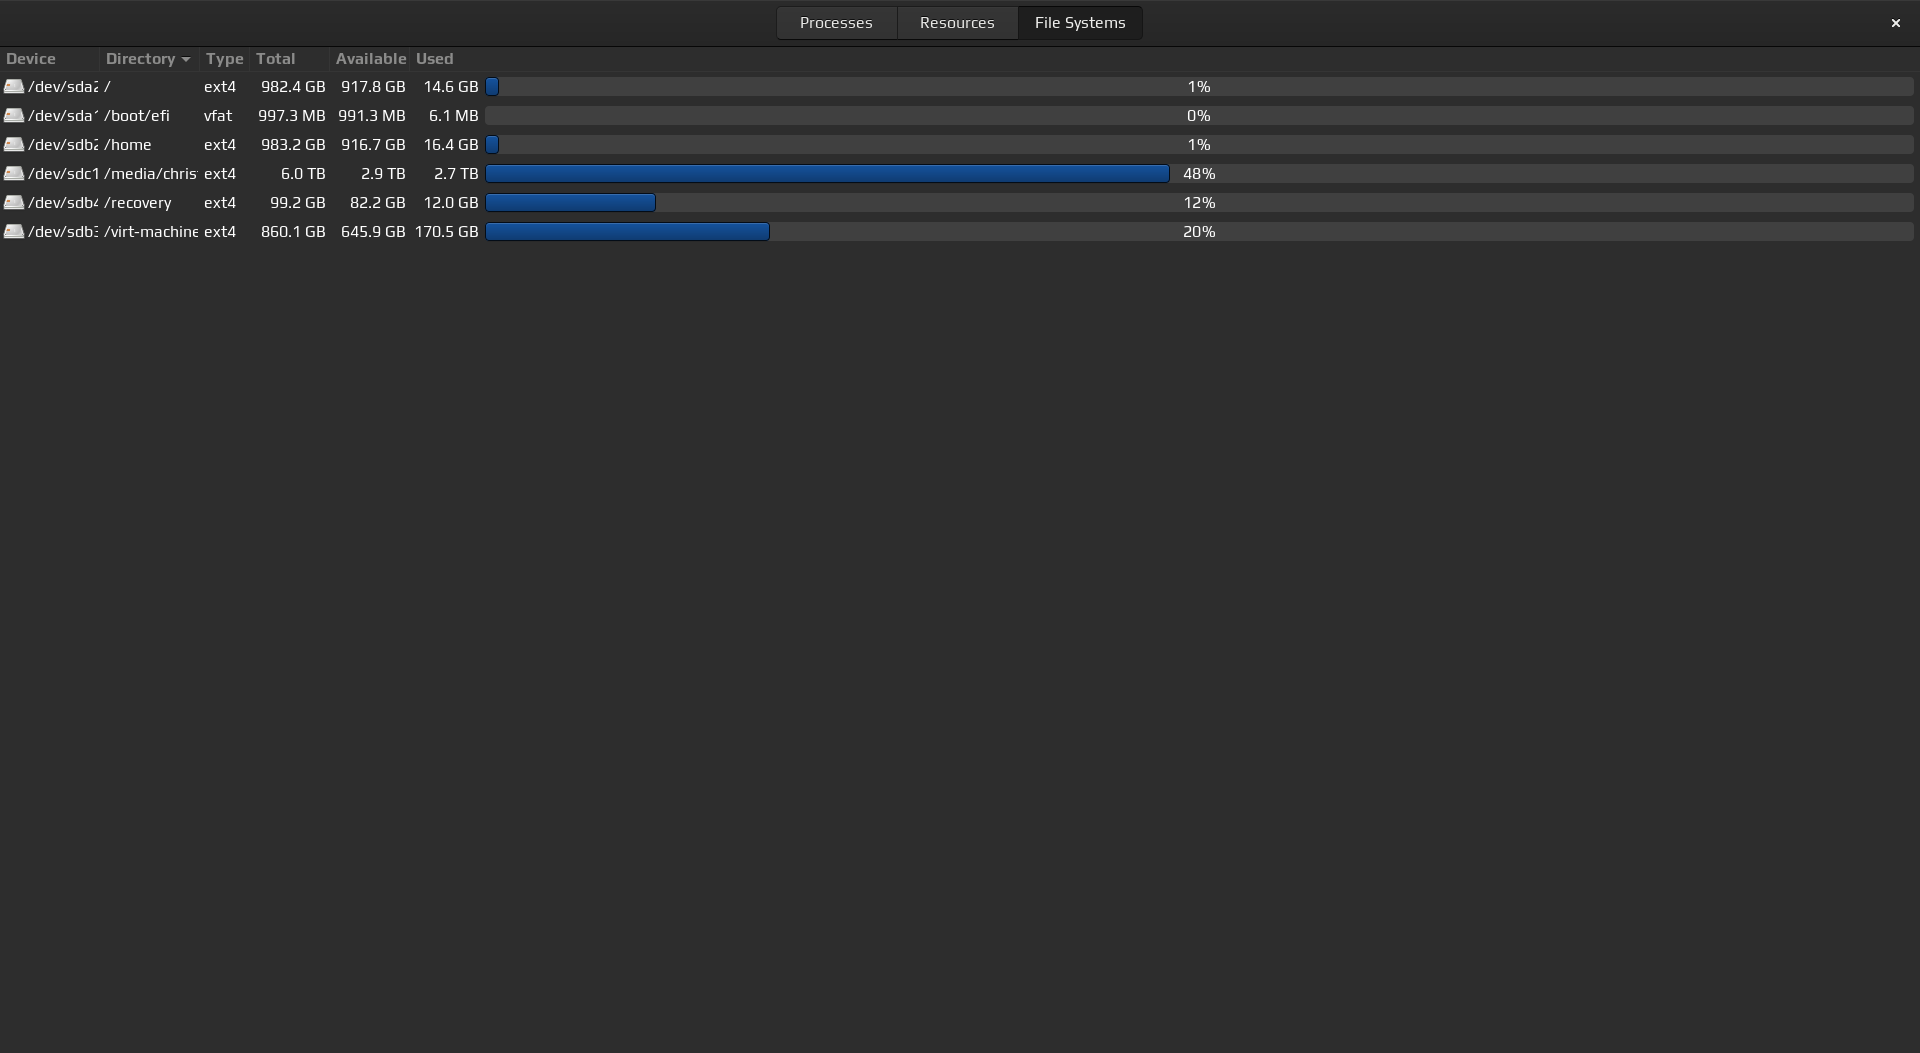
To find this tool, click on your super key, type system monitor and hit enter. The following window with open. If you are wondering what your system is up to, this is a good place to start. Usually just enough information without being overwhelmed. Tools that are run in the terminal are shown in the next section.
PROCESSES

There are many ways to monitor running processes on your machine. Some of which are graphical applications that typically come installed with the operating system by defualt. such as the System Monitor. But there are also many other great options that are able to run in the terminal.
01
Top
Top is a program that provides a dynamic real-time view of a running system. A list of running processes are shown with the added ability to kill off any that may be getting out of hand if more resources are required. Use the following command to launch the application.
Launch Top
This tool will come pre-installed by defualt on almost all GNU/Linux based systems.
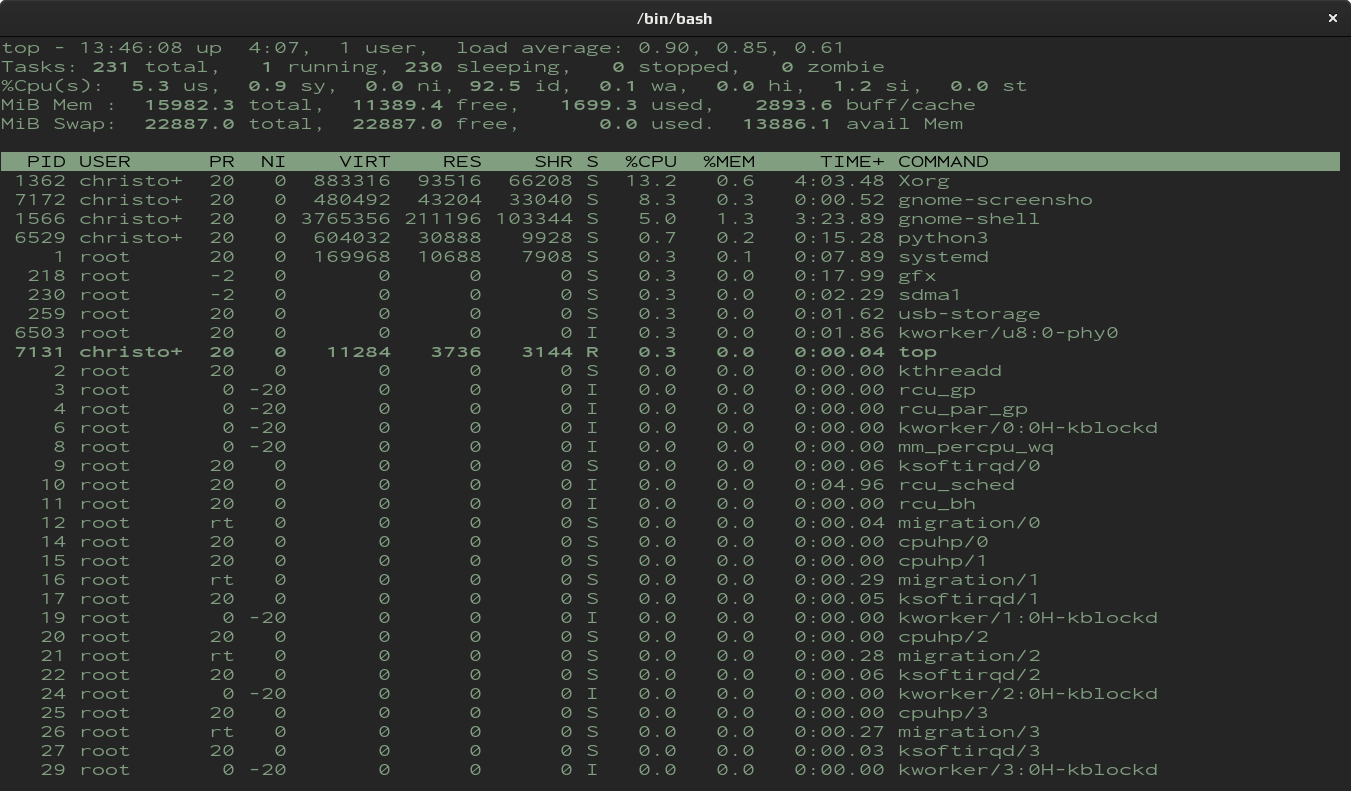
After launching the application you will see that there are two main areas. Up top, is the dashboard which can be thought of as the summary area, then below that is the process list.
Killing a process can easily be done by pressing the letter k followed by the PID.
Manual page for top
If you would like to read more documentation about Top, you can refer to it's man page
02
Htop
Very similar to Top, Htop also allows you to see all of the processes that are running on the system. Multiple processes can be selected at the same time as well as shown as a tree format.
Install Htop
The following commands can be used to install Htop.
fossworkx@linux-server:~$ sudo apt install htop
Launch Htop
To launch the application, the following command can be used
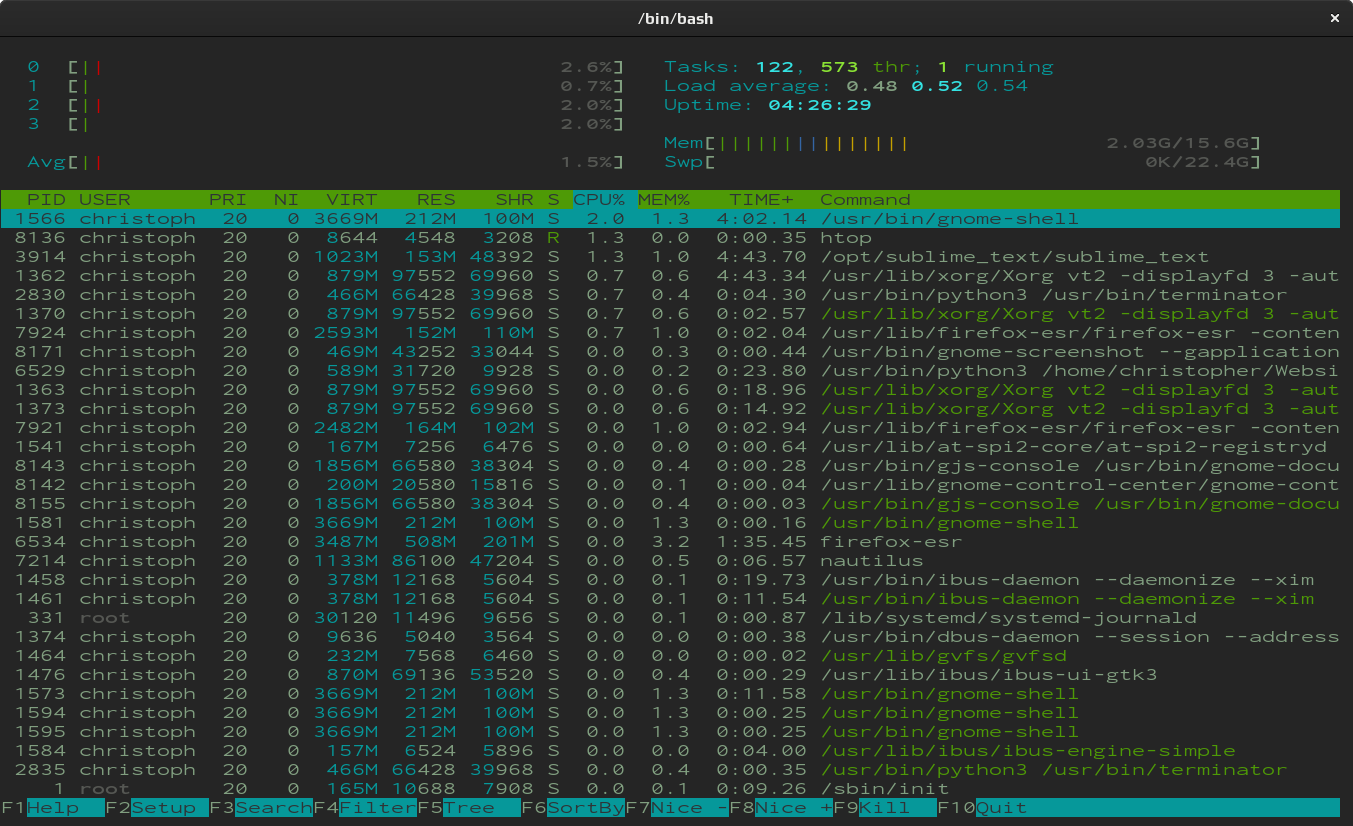
Killing a process can easily be done by using the arrow keys to select it, followed by pressing F9, then enter. If you would like to manually kill it, take note of the PID, close the application, then use the kill command followed by the PID
Show list of options
Show manual page for Htop
Similar to Top, Htop has many other options and features available. For a more extensive list or if you would just like to read more about this tool, refer to the man page.
03
ps (process status)
This command is used to list running processes along with their PID's. With the use of options, greater detail in the output can be provided.
Run ps
Use the following command to run ps with it's defaults
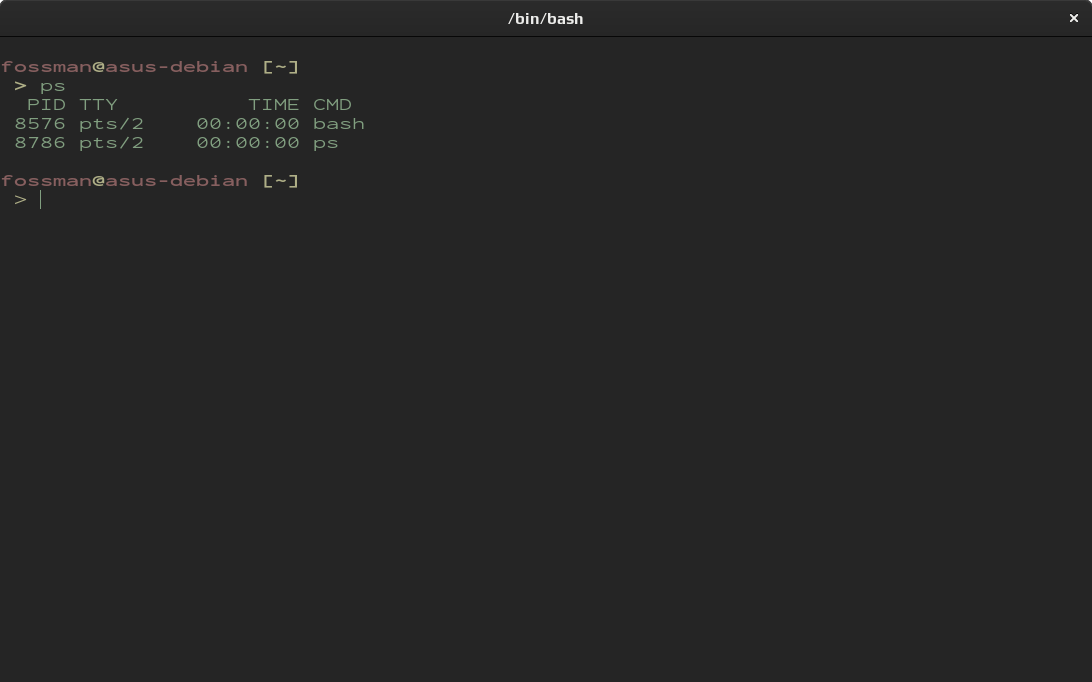
As you can see from the output, both processes running within the shell are returned. In addition, there is the -a flag to see processes running for all users. the -u flag can be used to show detailed information about each one and the -x to include processes run by daemons.
Run ps with options
Run ps with filter (firefox-esr)
Running this command may produce far more output then is required. To filter the results, the grep command can be added. In this example we'll return all firefox-esr processes
Show processes running under root
You'll also have the ability to search for processes that are being run by a particular user. The following command will show all processes that are running under root
DISKS & DRIVES

As you may have guessed, there are many tools which will allow you to check the heath and available storage of your disks and drives. The ones metioned below will most likely come pre-installed by defualt, and are extremely user friendly.
01
Gnome Disks
At the top of list, is gnome-disks. Not only is this application easy to use, it is very powerful and comes with many great features. Even advanced long term Linux users often fall back to this tool due to the fact it is so reliable and consistent across many different Linux distributions. It can be launched through the terminal or by the graphical application manager.
Launch gnome-disks
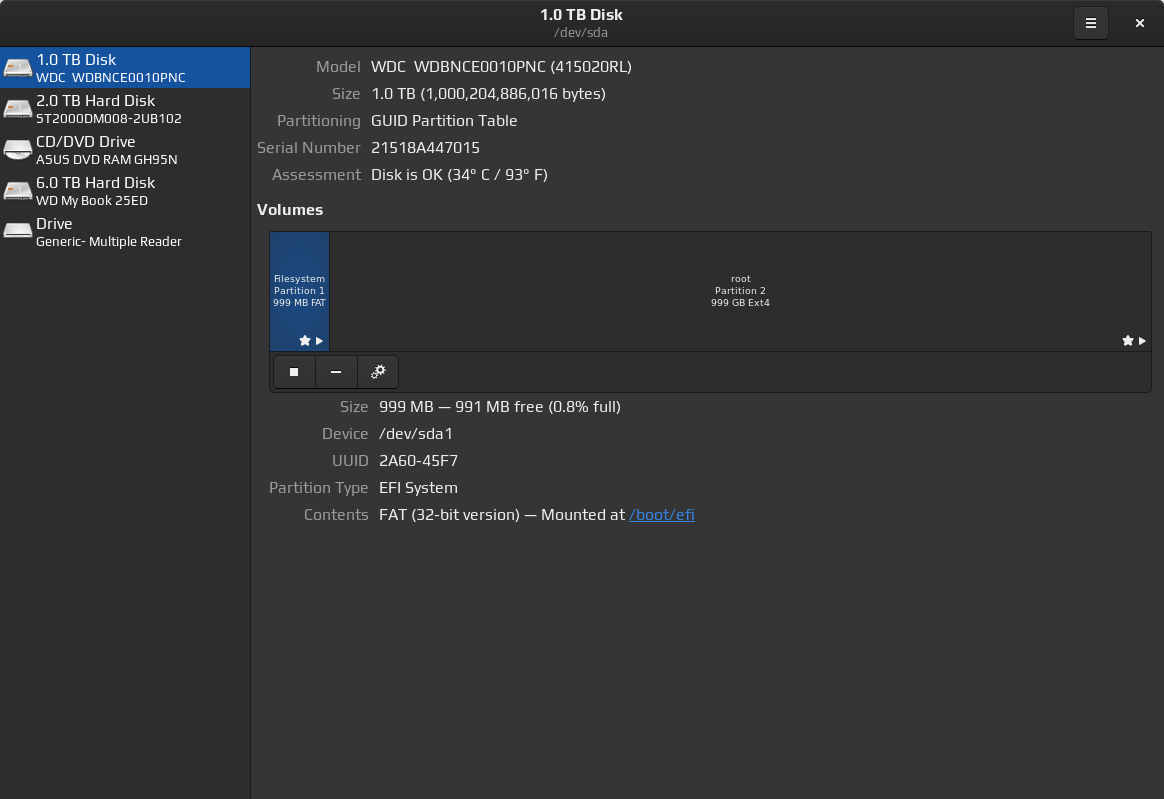
Gnome Disks offers an extensive tool set that will enable you to easily inspect, partition and configure your disks and block devices.
It can also be used to view S.M.A.R.T data, benchmark physical disks and create bootable USB drives.
02
df (disk free)
If you are already working in a terminal and want some information about your disks and drives without having to leave and open up graphical tool, there are many great tools that can be used to return this information right in the terminal.
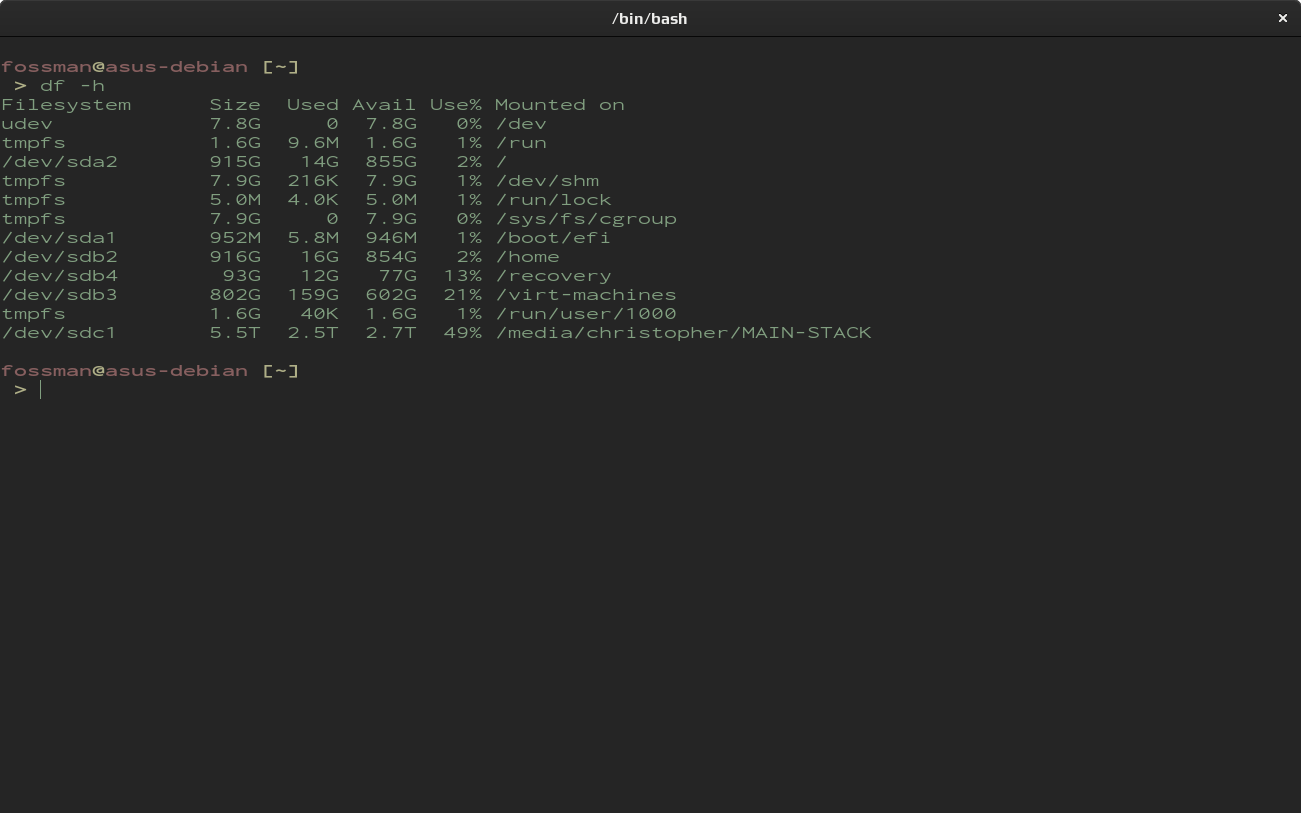
Disk Free displays the amount of disk space available on the file system. Individual files can be passed in as arguments or if left blank, the disk space for all mounted devices will be shown.
Launch df (disk free)
Use the following command to show disk information in a human readable format.
03
du (disk usage)
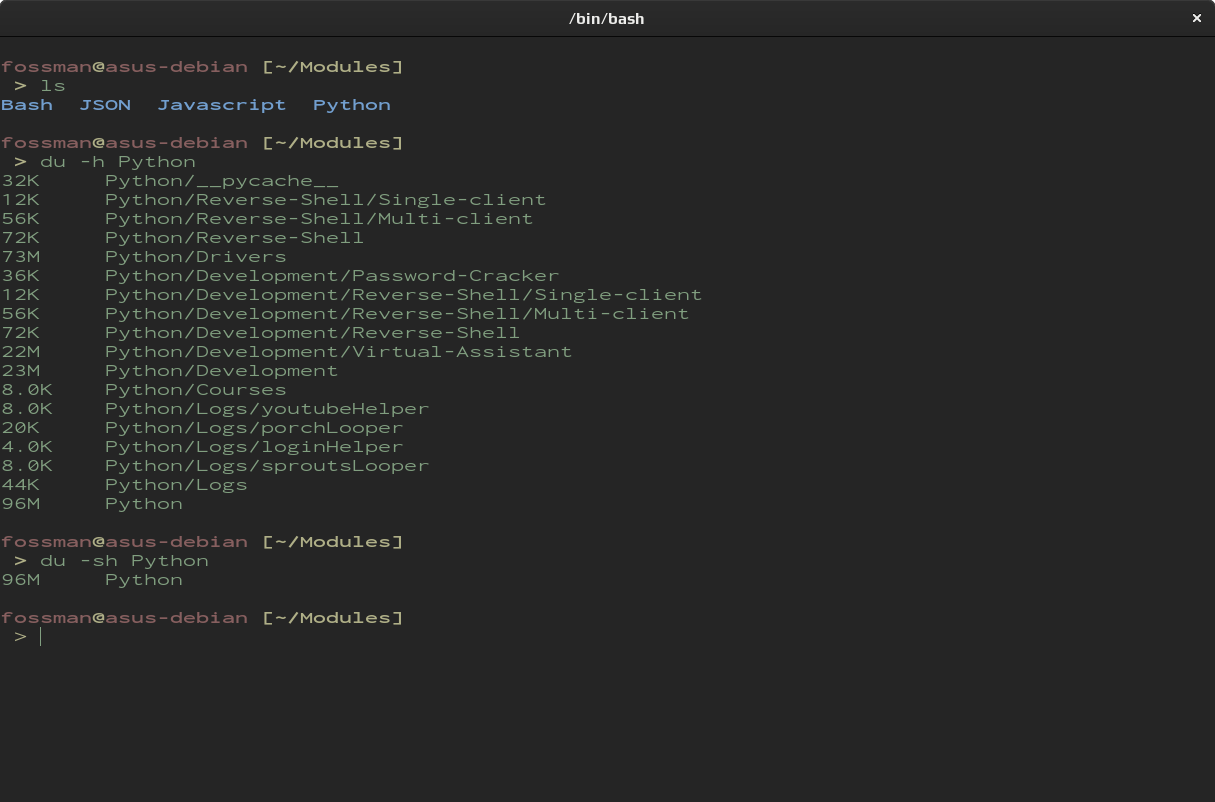
du is a utility used to summarize disk usage of a file or directory. All that is required, is to call the program and pass in the location to the file or directory. After which, du will return the amount of space taken on the drive. Example shown below.
Launch du (disk usage)
The following command is using the -h flag. Which will show the output in human readable from. The -s flag can be used to show the output in a summarized format.
fossworkx@linux-server:~$ du -sh
04
free
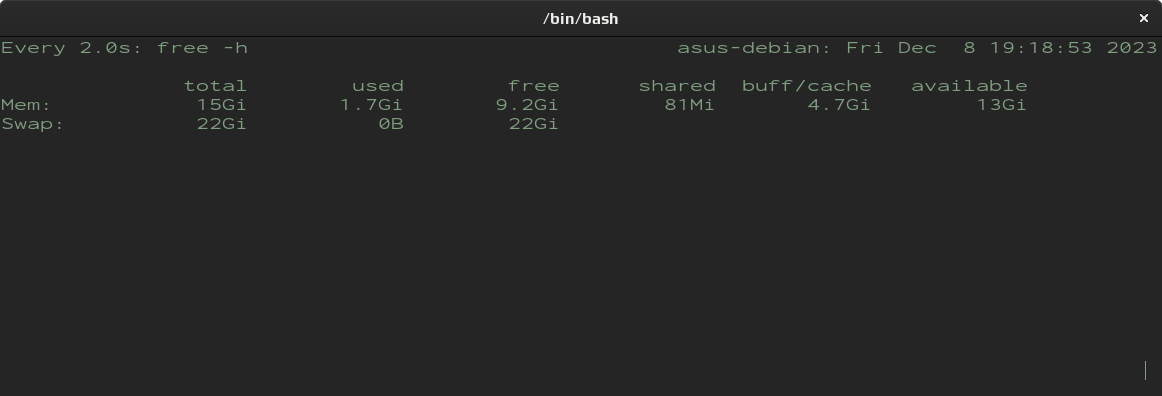
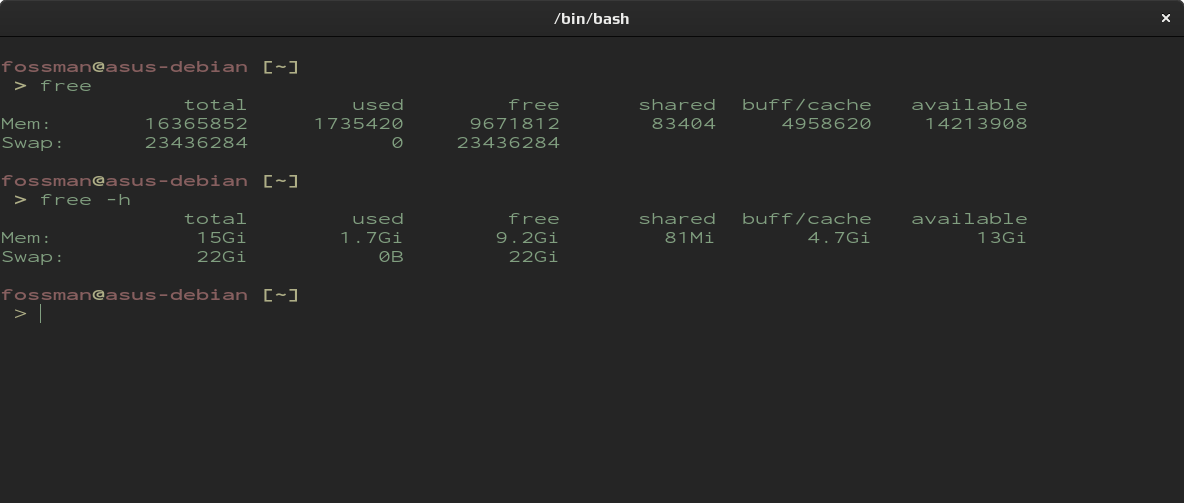
free displays the total amount of free and used physical and swap memory in the system, as well as the buffers and caches used by the kernel. If you want to quickly see how much memory your system is using you can start with the free command.
Run free
The following command is using the -h flag. Which will show the output in human readable from.
Run free in real time
If you would like the output to update in real time, the watch command can be added. The default interval is 2 seconds.
